What is a Flowchart?
A flowchart is one of the most common diagrams used to represent a process or workflow. It describes a process with a fixed sequence of steps and illustrates complex processes step-by-step in an understandable way. It is a versatile tool that may be used to define a number of procedures, including administrative, service, and project planning procedures as well as manufacturing processes. It is a fundamental quality instrument and a typical tool for process analysis.


The history of flowcharts
The use of flowcharts to document business processes began in the 1920s and '30s. The first flowcharts were documented in 1921. Two industrial engineers from the American Society of Mechanical Engineers (ASME) presented a process diagram based on graphs – the flowchart we know today. The use of the diagram increased steadily, resulting in the creation of the first so-called "symbol set systems" with process diagrams for flowcharts in 1947. Over time, a common symbolism for creating this type of diagram became established to describe computer algorithms and continues to this day. One centurie after its creation, the flow chart remains a favorite method for creating sequence descriptions and defining tasks.
Flowchart symbols
Different steps, decision points, and courses through a process are displayed using flowcharts, which are visual representations of processes and systems. They are used to understand, analyze, and optimize processes in a range of industries, including software development, engineering, business, and education. A well-made flowchart should be simple to understand and show the stages in a logical order. Flowcharts specify various shapes and (flow) elements that are used to visually represent workflows. For people unfamiliar with the subject, the use of the various shapes may seem arbitrary at first glance, however all icons stand for very specific components of a process. While detailed flow charts such as a program flowchart require a large number of symbols, simple business processes can be described with just a few shapes. Special flowchart software such as BIC Process Design have an extensive selection of icons and make it possible to create process flowcharts easily and quickly. In contrast to applications such as Microsoft Word, Excel, or PowerPoint, where the representation of process flows in a diagram has to be configured manually, professional flowchart software solutions offer corresponding flow chart templates for a quick capture of sequences. In BIC Process Design, for example, charts can be created with a simple drag and drop of the required shape from the symbol panel to the desired location in the editor.
In the following you will see an overview of the most common shapes as well as suitable flowchart examples for better clarification:

Start/end symbol
The oval represents the start or end of a sequence (e.g., invoice has been received).

Data icon (input/output)
This can be used to display used or generated resources or data (e.g., customer database).

Process/activity icon
The rectangle represents a process step (e.g., invoice check).
Connecting arrow
All flow elements are connected with each other by arrows illustrating the chronological order of the process steps in the chart.

Decision symbol
The rhombus indicates a request that has at least two outputs (e.g., invoice paid? - yes/no).
The chart symbols described above serve a uniform structure of the processes and ensure a common understanding of the diagram. Depending on the objective and scope of the diagram, other shapes and symbols can also be used, as well as non-standardized forms. In practice, however, you should avoid an excessive use of different symbols in the chart and pay attention to a continuous use of the shapes in order to maintain consistency and process understanding for your team members.
Types of process flowcharts
Due to a wide range of use cases, there are different types of flowcharts. Let us take a closer look at the three most common types of diagrams:

Superior flowchart
With the superior flowchart, the focus is on the process flow with a consistent direction. Start and end are clearly defined. The individual steps are represented with different shapes and fields. The so-called low-flow diagram shows a basic overview of a business process but can include sub-steps or intermediate results as well.

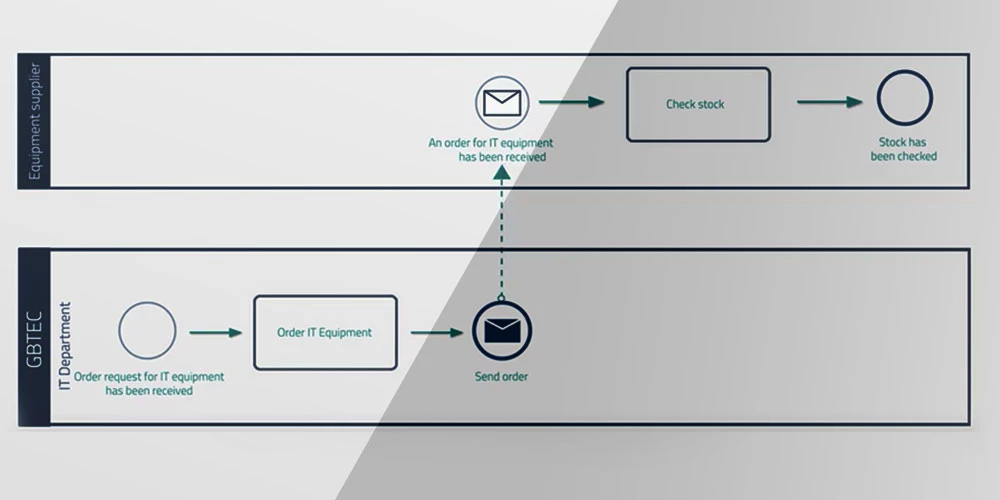
Swimlane diagrams (cross-functional diagram)
Swimlane flowcharts are featuring a swimlane component that aids in classifying a chart's nodes into the right team or party. Here, the process steps are divided into categorized columns. The columns are usually categorized into role, department, and process phase. Depending on the use, this swimlane representation is useful to distinguish affiliations and requirements faster.

Business Process Model and Notation (BPMN)
The standard for the representation of business processes: BPMN is considered a recognized modeling language in process management. There are various conventions and best practices that are specified. The representation method is based on the flowcharting but is used exclusively for business processes. More information about BPMN.
Checklist for creating your flowchart
When modeling process flows using flow chart templates, you should follow these modeling rules:
- There is a start and end event
- All symbols are clearly labeled
- The sequence is shown fluidly: from top to bottom or left to right
- The (connecting) arrows are not crossing each other
- All decisions have at least two outputs (e.g., yes/no)
- All activities are described with a noun and a verb (e.g., check invoice)
Advantages of using flowcharts
Using flowchart templates to illustrate workflows has many advantages, especially for companies with complex processes:
- Comprehensible presentation of current workflows
- Possibility of monitoring processes or data collections
- Analysis of processes and identification of improvement potentials
- Creation of a common understanding of the processes
- Holistic overview of all information, documents and resources of a process
- Integration of quality, document and risk management

Which software tools are suitable to create a flowchart?
There are countless use cases for flowcharts, which are used in many different fields, functions, and roles. While the first process representations, for example in computer science classes, are usually still configured manually using diagrams in a Word document, Excel or PowerPoint, companies largely use special software for this purpose. Here, a distinction must be made between free flowchart maker and professional flowchart software such as BIC Process Design. Modeling flowchart software like BIC Process Design make it possible to visualize complex processes quickly and easily with the help of an extensive selection of diagram types and symbols as well as an easy-to-use user interface. Integrated conformance checks ensure a consistent representation and uncover errors in the process chain. Procedures such as inserting, modifying, formatting, or deleting objects are all done in one click. With the integrated portal, all users have access to the released processes and are automatically informed by the software in case of changes in the flowchart tool. Collaboration functions enable easy exchange between the process participants and support a continuous improvement process. This is additionally strengthened by preconfigured reports and analyses that reliably reveal weak points and optimization potential. Automated governance workflows and integrated document and risk management ensure fully comprehensive and compliance control of your process flows.
You are looking for a flowchart software to model your business processes? Then take a look at BIC Process Design!
Use BIC Process Design and choose your favorite from our extensive set of modeling methods. Benefit from easy process capture, comprehensive analyses and a browser-based portal for all users.
Process Modeling with
BIC Process Design
Our innovative BPM tool BIC Process Design ensures more transpareny and smooth work processes. Find out how easy it can be to model your processes, give access to them company-wide and jointly optimize workflows.
Test BIC Process Design
30 days for free
BIC Process Design impresses users worldwide with its unique user-friendliness and innovative design. Convince yourself of the powerful functionalities of our BPM software and model your first processes in our trial version.
Further resources
We have the information you need to unleash your full process potential. Take a look at our resources and start improving your business performance today.


GBTEC Software AG
Gesundheitscampus-Süd 23
44801 Bochum
Germany

Further Information
Career
Webinars & Events
Videos
Podcast
Newsletter